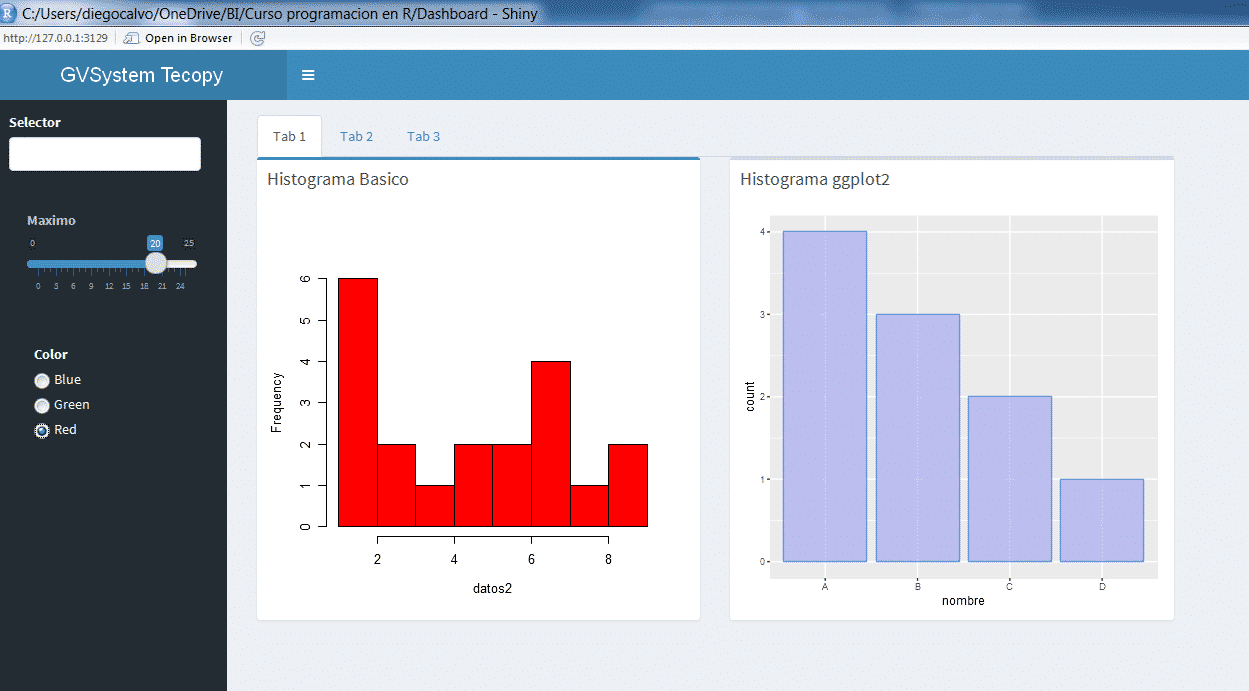
Ejemplo Dashboard Shiny
library('shiny')
library('shinydashboard')

# Fijar el directorio de trabajo en el lugar de donde esta el archivo ejecutandose
setwd(dirname(rstudioapi::getActiveDocumentContext()$path))

# Cargar fichero para exportar funciones
source("histograma.R")

# ---------------------
# Barra Lateral - Sidebar
# ---------------------
sidebar <- dashboardSidebar(
  sidebarMenu(

    # Selector de fechas
    selectInput("selector", "Selector",
                choices = c(2000:2013), multiple=TRUE, selectize=TRUE,
                width = '95%'),


    # Input inside of menuSubItem
    menuSubItem(icon = NULL,
                sliderInput("maximo", "Maximo", min=0, max=25, value=20,
                            width = '95%')
    ),


    box(
      width = 1, solidHeader = TRUE,
      radioButtons("color", "Color", # inline = TRUE,
                   c(Blue = "blue", Green = "green", Red = "red")
      )
    )
  )
)


# ---------------------
# cuerpo - Body
# ---------------------

body <- dashboardBody(

  mainPanel(
    tabsetPanel(type = "tabs",
      tabPanel("Tab 1",

         fluidRow(
         box(
           title = "Histograma Basico",
           status = "primary",
           plotOutput("grafico1", height = 400)
          ),

          box(
            title = "Histograma ggplot2",
            plotOutput("grafico2", height = 400)
          )
        )

      ),

      tabPanel("Tab 2", h2("Tab 2")),

      tabPanel("Tab 3", h2("Tab 3"))
    )
  )
)


# ---------------------
# Inteface - UI
# ---------------------

ui <- dashboardPage(
  dashboardHeader(title = 'GVSystem Tecopy', titleWidth = 290),
  sidebar,
  body
)


# ---------------------
# Servidor - Server
# ---------------------

server <- function(input, output) {

  output$grafico1 <- renderPlot({
    if (is.null(input$maximo) || is.null(input$color))
      return()

    visual(input$maximo,input$color)

  })

  output$grafico2 <- renderPlot({
     source("histograma2.R")
  })

}

# ---------------------
# Aplicacion Shiny
# ---------------------

shinyApp(ui, server)


0 comentarios